
Data reliability extends beyond assessing mere completeness and accuracy; it requires an understanding of how data quality fluctuates across diverse real-world conditions over time. When addressing data reliability, it’s imperative to move beyond evaluating data quality at isolated points in time and space.
Instead, the focus should be on establishing anticipated levels of quality and service. This encompasses determining the speed of communication and response to incidents, as well as ensuring readiness with the necessary tools to promptly diagnose and resolve data-related issues.
Drawing insights from software engineering, data professionals can glean valuable lessons in building resilient, highly available systems. In a previous article, I explored the significance of data reliability for data teams. Here, I delve into the practical application of this concept through engineering operations.
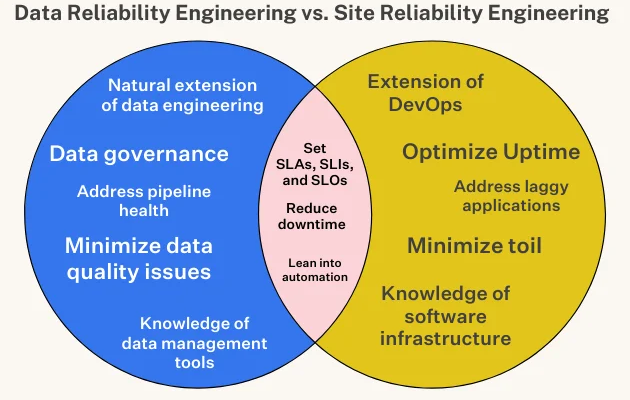
Coined by Google SVP Benjamin Treynor Sloss in the early 2000s, Site Reliability Engineering (SRE), a facet of DevOps, epitomizes “what happens when you task a software engineer with designing an operations function.” In essence, Site Reliability Engineers (SREs) develop automated software to enhance application uptime while minimizing operational burdens and reducing downtime. Additionally, SREs are likened to the “firefighters” of the engineering field, diligently addressing underlying bugs, sluggish applications, and system outages.
As data systems grow in complexity and significance within organizations, the same principles can be applied to our field in the form of data reliability — an organization’s capacity to maintain high data availability and health across the entire data lifecycle.
Data reliability through applying SRE/DevOps principles
While firefighting remains a central responsibility, Site Reliability Engineers (SREs) also play a crucial role in strategically managing risk by assessing the opportunity cost of introducing new features and innovations. To facilitate data-driven decision-making, clear Service Level Objectives (SLOs) are established, defining the desired reliability in real-world terms measured by Service Level Indicators (SLIs).
Once SLOs and SLIs are in place, SREs can effectively balance reliability with risk. Despite employing sophisticated solutions and seasoned professionals, achieving 100% system uptime is not guaranteed. Innovation necessitates iteration, and embracing some level of downtime is inevitable for progress. As one SRE colleague aptly put it: “it’s not a matter of if the site will go down, it’s a matter of when.”
Just as SREs strike a balance between reliability and innovation, it’s imperative to ensure that data pipelines remain reliable yet flexible enough to accommodate new data sources, business logic, transformations, and other variables beneficial to both organizations and customers.
Similar to the meticulous management of application downtime, minimizing data downtime—periods when data is inaccurate, missing, or erroneous—is paramount. Major application downtime incidents affecting companies like GitHub, IBM, DoorDash, and Slack underscore the seriousness of data downtime as a significant threat.
Poor-quality data not only leads to inferior decision-making but also imposes substantial time and financial burdens on teams responsible for managing data reliability. Dealing with data downtime is a common and resource-intensive challenge in data management. Numerous data leaders indicate that their data scientists and engineers spend 30 percent or more of their time resolving data issues, diverting valuable energy away from innovation and value generation.
Catch data reliability issues before anyone else does
Over the past several years, I’ve engaged in conversations with over 150 data leaders regarding the reliability of data, spanning from minor issues like a few null values to more significant challenges such as entirely inaccurate data sets. While each leader’s experiences varied, one common thread emerged: the consequences of data unreliability were far-reaching and impactful.
For instance, a Vice President of Engineering at a prominent high-end clothing rental company shared a sobering tale. Before his team implemented measures to monitor data downtime, they discovered that their entire database of customer information was off by 8 hours—a revelation that exposed significant technical debt. Worse yet, this discrepancy went unnoticed for several months, only surfacing during a data warehouse migration. Although rectifying the issue ultimately proved to be a straightforward task, the implications were profound. Analysts relying on timely data to drive informed decisions lacked confidence in their pipelines, resulting in revenue loss. Unfortunately, such incidents are not uncommon, and no company is immune to their repercussions.
Similar to how Site Reliability Engineering (SRE) teams swiftly address application crashes or performance issues, data teams should be empowered to identify and rectify bad pipelines and data quality issues promptly. Just six years ago, data loss and downtime incurred a collective cost of $1.7 trillion annually—a figure that has likely escalated in our data-centric era, where data management tools have yet to catch up.
To mitigate data downtime, achieving comprehensive observability over data throughout its entire lifecycle—from source to consumption—is imperative. Robust pipelines foster accurate and timely insights, facilitating informed decision-making, robust governance, and enhanced customer satisfaction.
Data quality vs Data Reliability
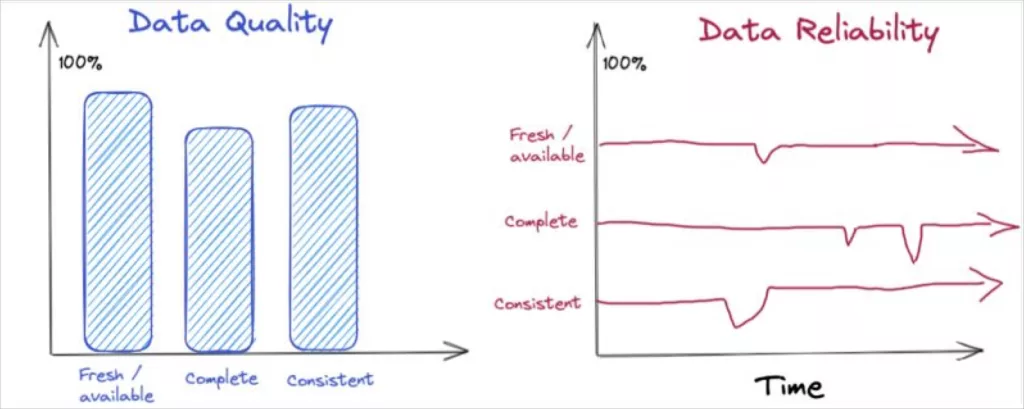
Data quality is commonly evaluated through six dimensions: accuracy, completeness, consistency, timeliness, validity, and uniqueness. These dimensions assess the suitability of data for specific use cases at particular moments in time.
However, achieving data reliability necessitates transcending mere point-in-time evaluations and considering how data quality evolves over time across diverse real-world conditions.
For instance, consider the reliability of an airline, which might be gauged by metrics like timeliness (percentage of flights on-time), safety (major incidents), and service quality akin to that of a diner. To be deemed reliable, the airline must consistently maintain these quality standards over time, regardless of factors such as route variations, weather conditions, and holiday periods.
Similarly, the quality of a data product could be evaluated based on factors like availability at 9am, completeness of records, and consistency compared to a source-of-record. To ensure reliability, it is crucial to assess whether the data product sustains these service levels consistently over time, even amidst surges in holiday traffic and product launches.
Addressing data reliability requires more than just measuring data quality at a specific point in time and space. It entails establishing anticipated levels of quality and service, such as defining response times to incidents, and equipping oneself with the necessary tools to swiftly diagnose and address data-related issues.
How do I make my data reliable?
I suggest two main approaches for data teams to attain high data reliability within their organization: 1) establish data Service Level Objectives (SLOs), and 2) deploy automated solutions to minimize data downtime.
Leverage a data observability platform to set SLOs and SLIs
Utilize a data observability platform to establish Service Level Objectives (SLOs) and Service Level Indicators (SLIs). While setting SLOs and SLIs for system reliability is a standard practice for any Site Reliability Engineering (SRE) team, it’s time to extend this approach to data management as well. Some companies have already embraced this concept.
In data, SLOs represent the desired values that a data team aims for across specific SLIs. These SLOs vary depending on organizational needs and customer requirements. For instance, a B2B cloud storage company might aim for no more than 1 hour of downtime per 100 hours of uptime, while a ridesharing service might focus on maximizing uptime.
When defining your data SLIs, consider the five pillars of data observability. These pillars serve as key data SLIs: Freshness, Distribution, Volume, Schema, and Lineage.
- Freshness: Assess the timeliness and update frequency of your data tables.
- Distribution: Evaluate whether your data falls within an acceptable range of values.
- Volume: Measure the completeness of your data tables to gauge the health of data sources.
- Schema: Monitor changes in data schema, which may indicate data integrity issues.
- Lineage: Trace the origin and flow of data to understand its journey and identify any potential disruptions.
While many data teams are eager to integrate with advanced data infrastructure and business intelligence tools, it’s essential to remember that the effectiveness of these solutions hinges on the quality of the underlying data. Implementing these SLIs will provide valuable insights into the quality and reliability of your data, helping you make informed decisions and build trust in your data assets.
Shift data reliability left and prevent issues before they occur
While you cannot completely eliminate bad data through architecture alone, you can enhance data reliability by minimizing the occurrence of data incidents.
Start by identifying your critical datasets—these are the tables that are frequently queried and have significant downstream impacts on consumers. Next, assess the feasibility of implementing preventive measures such as data contracts or circuit breakers. Data contracts help prevent downstream issues stemming from unexpected schema changes, while circuit breakers halt the data flow into the warehouse if it fails to meet predefined criteria.
Although these best practices require time and effort to implement, they are crucial for maintaining the reliability of production-grade pipelines and ensuring the integrity of your most valuable data products. It’s essential to apply these techniques judiciously to avoid inadvertently increasing data downtime.
Establish ownership
Establishing ownership may sound simple in theory, but it’s often more complex in practice. While most data leaders recognize the importance of clear ownership for swift action and accountability, the need for multiple layers of ownership is frequently underestimated.
Ownership for data quality should be delineated at various levels within the organization: at the organizational level, domain or project level, and even at the pipeline or table level. These ownership structures should be linked back to the owners of the business processes supported by the data. Additionally, mechanisms should be in place to address conflicts that may arise between these ownership spheres. For instance, if a crucial asset table is utilized by both marketing and finance, who holds ownership?
To tackle these challenges, we recommend the following strategies:
- Create a data team RACI (Responsible, Accountable, Consulted, and Informed) matrix specifically for data quality.
- Establish Service Level Agreements (SLAs) that define ownership responsibilities for key tables and data products. Data product managers can play a valuable role in this process.
- Where ownership lines intersect, appoint a “custodian” who holds primary ownership but must consult other data team stakeholders before making any changes.
Document assets
Documenting data assets is a critical yet often overlooked task for data engineers. Without proper documentation, mistakes are more likely to occur, and the potential for self-service discovery is diminished. However, the challenge lies in the vastness of available data and the limited capacity of humans to document it comprehensively.
To address this challenge, consider the following strategies:
- Iterate and automate: Focus on documenting key assets such as tables, views, and schemas as a “minimum viable product.” Use tools like Monte Carlo to identify key data assets and their owners, streamlining the documentation process.
- Tie documentation to data onboarding: Implement mechanisms that require documentation before new datasets can be added to the data warehouse or lake environment. This ensures accountability and promotes a culture of documentation ownership.
- Measure documentation levels: Track the percentage of data assets that are appropriately documented using dashboards or scorecards. This provides visibility into documentation efforts and helps prioritize areas for improvement.
- Leverage integration with other sources: Integrate documentation solutions within the modern data stack, such as data catalog platforms or tools like dbt. Additionally, train data consumers to utilize existing sources of information, such as Slack channels, for quick access to documentation and context.
By adopting these strategies, data teams can improve the reliability and usability of their data
assets, facilitating better decision-making and data-driven insights.
Conduct post-mortems
Conducting post-mortems is crucial for improving data reliability by learning from incidents and preventing their recurrence. Here are some best practices to follow:
- Frame incidents as learning experiences: Post-mortems should focus on identifying root causes and lessons learned rather than assigning blame. This blameless approach fosters a culture of continuous improvement.
- Assess readiness for future incidents: Use post-mortems as an opportunity to evaluate the effectiveness of your incident response processes. Update runbooks, refine monitoring and alerting systems, and adjust workflow management tools to enhance preparedness for future incidents.
- Document and share post-mortem findings: Documenting each post-mortem ensures that insights and solutions are captured for future reference. Sharing these findings with the broader data team promotes transparency and knowledge sharing, reducing the risk of knowledge gaps in case of personnel changes or unavailability.
By conducting post-mortems and implementing these best practices, data teams can strengthen their incident response capabilities and enhance data reliability over time.
Use data health insights to understand hot spots
Pareto’s principle, often referred to as the 80/20 rule, remains highly relevant in the field of data engineering, particularly concerning data quality issues and pipelines. In essence, it suggests that approximately 20% of your tables or pipelines may be responsible for around 80% of your data quality challenges. Identifying these problematic areas and aligning them with key assets can guide your allocation of data quality resources effectively. While this task may present challenges, leveraging tools like a data reliability dashboard can facilitate this optimization process.
Moreover, Pareto’s principle can be applied beyond individual tables to domains within your organization. By analyzing data quality metrics across different domains, you can pinpoint areas that require the most attention. For instance, Monte Carlo’s data reliability dashboard offers insights into domains with the highest incident rates or longest time to response.
Brandon Beidle, Director of Data Product at Red Ventures, underscores the importance of measuring performance and addressing issues proactively. He highlights the shift from subjective evaluations to evidence-based assessments, enabling teams to focus on areas that require optimization or resource allocation. Additionally, insights into data health can aid in preempting table versioning issues and identifying deteriorating queries before they escalate into significant problems.
Invest in data reliability
The reality is, whether consciously or not, you’re already investing in data reliability. Your team may be manually verifying data, crafting custom validation rules, or dealing with the consequences of decisions made on flawed or unnoticed errors. It’s a costly endeavor.
But there’s a more efficient path forward. Similar to how site reliability engineers harness automation to ensure application uptime, data teams can leverage machine learning-driven platforms to simplify and enhance data reliability. By adopting such platforms, you can gain automated, scalable observability into your pipelines, facilitating instrumentation, monitoring, alerting, troubleshooting, resolution, and collaboration on data issues. This proactive approach reduces data downtime rates, thereby bolstering the reliability of your entire data infrastructure.
Armed with clear Service Level Indicators (SLIs), Service Level Objectives (SLOs), and a fresh strategy for data reliability, we can now entrust firefighting to the experts.


Comments